Becoming a parent is exciting, confusing, and filled with endless questions — especially about whether your baby is “growing normally.” That’s exactly where an infant growth chart becomes your most valuable tool.
A newborn growth chart helps parents track their baby’s weight, length (height), and head size month by month. It’s not just about numbers; it’s a window into your baby’s overall development, nutrition, and health.
In this complete guide by ZaminoToys, you’ll learn how to read, use, and interpret the baby growth chart, featuring Indian baby data and simple, actionable tips to ensure your child achieves healthy infant growth.
📈 What Is a Newborn Growth Chart?
A newborn growth chart is a scientifically designed, standardized graph or table used to monitor a baby’s physical development by tracking three key measurements:
- Weight
- Length/Height
- Head Circumference
Doctors and pediatricians use these infant growth charts during each check-up to ensure your baby is developing within the expected percentile range.
Fun Fact: The WHO (World Health Organization) developed standard infant growth charts based on healthy, breastfed babies from six countries — including India. This ensures the data is globally relevant and appropriate for the Indian context.
👶 Why Tracking Baby Weight and Height is Crucial
Your baby’s infant growth pattern tells a detailed story. A steady, consistent rise in baby weight and height means your little one is receiving the right nutrition and developing properly.
Scientifically, an Infant Growth Chart helps:
- Monitor nutritional intake (crucial for evaluating breastfeeding vs. formula-fed babies).
- Detect early signs of developmental issues, poor nutrition, or potential underlying health concerns.
- Evaluate if your baby’s bones and organs are growing normally.
- Build better feeding and play routines aligned with their developmental stage.
When used correctly, the newborn growth chart becomes your personal health report card for the first two years of life.
🏥 WHO-Recommended Newborn Growth Chart (India 2025 Data)
Below are the average newborn weight and baby height charts based on WHO standards and the Indian Academy of Pediatrics (IAP) data, updated for 2025.
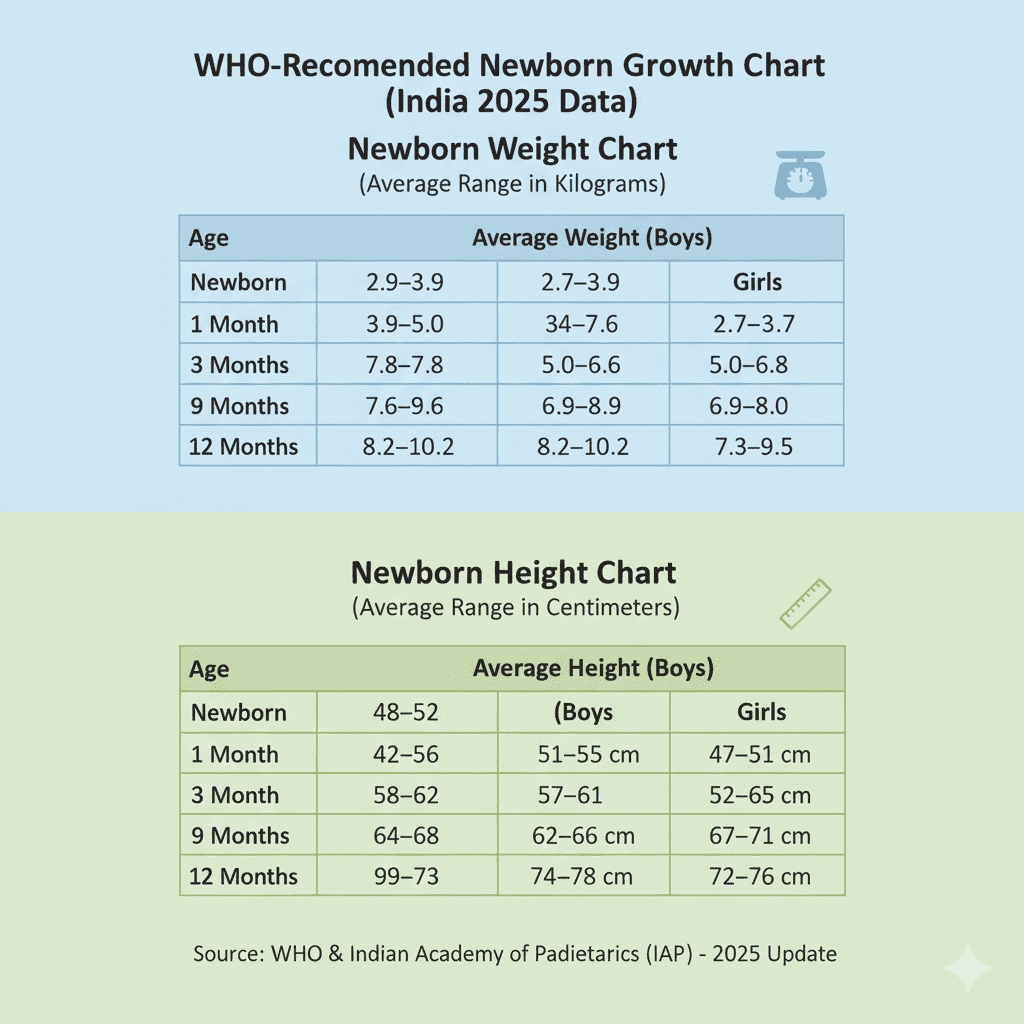
📊 Newborn Weight Chart (Average Range in Kilograms)
| Age | Average Weight (Boys) | Average Weight (Girls) |
| Newborn | 2.9 – 3.9 kg | 2.7 – 3.7 kg |
| 1 Month | 3.9 – 5.0 kg | 3.4 – 4.6 kg |
| 3 Months | 5.8 – 7.5 kg | 5.0 – 6.8 kg |
| 6 Months | 7.0 – 8.8 kg | 6.4 – 8.0 kg |
| 9 Months | 7.6 – 9.6 kg | 6.9 – 8.9 kg |
| 12 Months | 8.2 – 10.2 kg | 7.3 – 9.5 kg |
📏 Newborn Height Chart (Average Range in Centimeters)
| Age | Average Height (Boys) | Average Height (Girls) |
| Newborn | 48 – 52 cm | 47 – 51 cm |
| 1 Month | 52 – 56 cm | 51 – 55 cm |
| 3 Months | 58 – 62 cm | 57 – 61 cm |
| 6 Months | 64 – 68 cm | 62 – 66 cm |
| 9 Months | 69 – 73 cm | 67 – 71 cm |
| 12 Months | 74 – 78 cm | 72 – 76 cm |
These infant growth chart ranges represent healthy averages. Your baby might be slightly above or below, and that is generally fine, as long as the growth curve remains consistent.
📊 How to Read Your Baby’s Growth Chart Correctly
Understanding a newborn growth chart isn’t about comparing your baby to others; it’s about following their own unique progress line.
Here’s how to effectively track your baby’s height and weight at home:
- Record Measurements Monthly: Use a soft measuring tape for length and a certified baby scale for weight.
- Plot on the Chart: Compare your baby’s data to the WHO percentile standards (your pediatrician will do this, but you can track the numbers).
- Watch the Curve: A smooth upward line indicates consistent, healthy infant growth. A drop, plateau, or erratic curve is a flag.
- Consult Your Pediatrician: Always discuss the data if growth drops or stalls suddenly.
Tip: Combine this growth chart data with your baby’s vaccination chart and feeding schedule for a full, integrated health overview.
🧠 Factors That Influence Newborn Growth

Several factors influence how your baby’s weight and height progress on the infant growth chart:
- Genetics: Taller parents often have larger babies, and growth rate can be inherited.
- Nutrition: Breastfed babies typically gain weight at a slower but more consistent rate than formula-fed babies initially.
- Sleep: Growth Hormone (GH) peaks during deep sleep; good sleep patterns are essential for growth.
- Play & Movement: Physical activity, or tummy time, strengthens bones and muscles, contributing to healthy weight gain and posture.
- Health Conditions: Minor infections, cold, or temporary feeding issues can momentarily affect baby weight gain.
💬 FAQ: Common Parent Questions on Baby Growth
❓ What is the most important part of the newborn growth chart?
The most important part is the consistency of the growth curve, not the specific percentile number. As long as your baby maintains a smooth, upward trajectory on the baby weight and height chart, they are likely healthy and growing well. A sudden, sharp drop is what requires medical attention.
❓ What if my baby’s weight is below the average on the newborn weight chart?
Don’t panic. Every baby is different. First, check if your baby is alert, active, has plenty of wet and dirty diapers, and is feeding well. The newborn growth chart is a range, and being at the lower end can be normal, especially if both parents are petite. Consult your doctor if the curve starts to flatten.
❓ Does gender affect the newborn height and weight chart?
Yes, on average. The baby boys’ growth chart often shows slightly higher average weight and length compared to the baby girls’ growth chart, but the difference is minor. Individual variation is much more significant than gender.
❓ Can toys and play affect baby growth?
Absolutely. Early playtime improves physical coordination and muscle strength, which are essential for achieving developmental milestones like rolling, sitting, and crawling. These movements, in turn, contribute to healthy weight gain and posture.
🧸 How Toys Support Growth: The Science Behind Play
While a newborn growth chart tracks the physical numbers, play nurtures the invisible parts of growth — the brain, senses, and emotions.
For example:
- Soft rattles and grasping toys improve muscle control and fine motor skills.
- Play gyms and mats encourage crucial tummy time, enhancing stretching and mobility.
- Sensory toys (high-contrast, textured) stimulate neural growth and curiosity, supporting overall development.
🩺 When to Talk to a Pediatrician
While small variations are normal, you should consult your pediatrician immediately if your baby’s infant growth chart line:
- Suddenly Dips: A rapid fall in percentile across multiple measurements.
- Stays Flat: Zero or minimal weight gain for two or more months.
- Crosses Major Percentile Lines: Consistently falling from a high percentile (e.g., 75th) to a low one (e.g., 25th).
Remember — your newborn growth chart is not a report card; it is a vital guidance tool for a healthy and thriving baby.
🌟 Final Thoughts
The newborn growth chart gives parents a simple, powerful way to understand how their baby is developing. Every baby’s journey is unique, and small variations are completely normal.
The key to healthy infant growth is consistent progress, balanced nutrition, and daily age-appropriate play.
When you combine a healthy routine, emotional bonding, and the right toys, your child’s baby weight and height chart won’t just rise — they will thrive.


Pingback: Best Toys for 2 Year Old Montessori,Educational & Brain Toys